
North Carolina bootlegger
Chandler Avenue is a residential street on the north side of Joplin. It serves a number of small connecting subdivisions to the north, a well traveled artery. We’ve had a home on the south end of it for more than a dozen years now. People who live in the area drive past on the way to and from work each day and running errands in the evenings.
It also connects to a cross street up at the north end, which makes it a useful way to skip the business corridor running parallel just a few streets over. Drivers passing through in a hurry, while avoiding traffic signals and congestion.
One of the first things we noticed is that some people are driving fast. Shockingly fast. Like some crazed imitation of a North Carolina bootlegger trying to out run the revenuers. The speed limit is 25 mph.
There are no sidewalks on this street.
There are no sidewalks on this street. People are out walking together. Kids on bicycles, skateboards, someone out with a dog at dusk. That’s the part that stops being an idle annoyance and becomes a real safety concern.
The running joke
From the very first brainstorming for SentinelCam — years ago now — I used to threaten to model this. I was going to point a camera at the street, figure out who the regular offenders were, and predict them. It always got a laugh, mostly from me. It was never the plan.
The plan was facial recognition. A house that knows who lives here, who’s a guest, who’s a stranger in the driveway when nobody’s home. That was the original first solution prototype built for the project and where efforts were focused from the very beginning.
Facial recognition turned out to be much harder than I imagined it would be.
Not the detection — detection is fine. The problem is that a house is a data-poor environment for faces. The same handful of people, arriving at the same few doors, occasionally caught at a usable angle by luck. You can go a week and collect almost nothing worth training on. I spent a long time building an increasingly sophisticated pipeline to process a trickle.
…and then I pointed a camera at the street
Not for any grand reason. I was weary of the struggle for faces, and the camera was sitting on the window sill, pointing into the room. On a whim, I just turned it around and pointed it outwards facing the street.
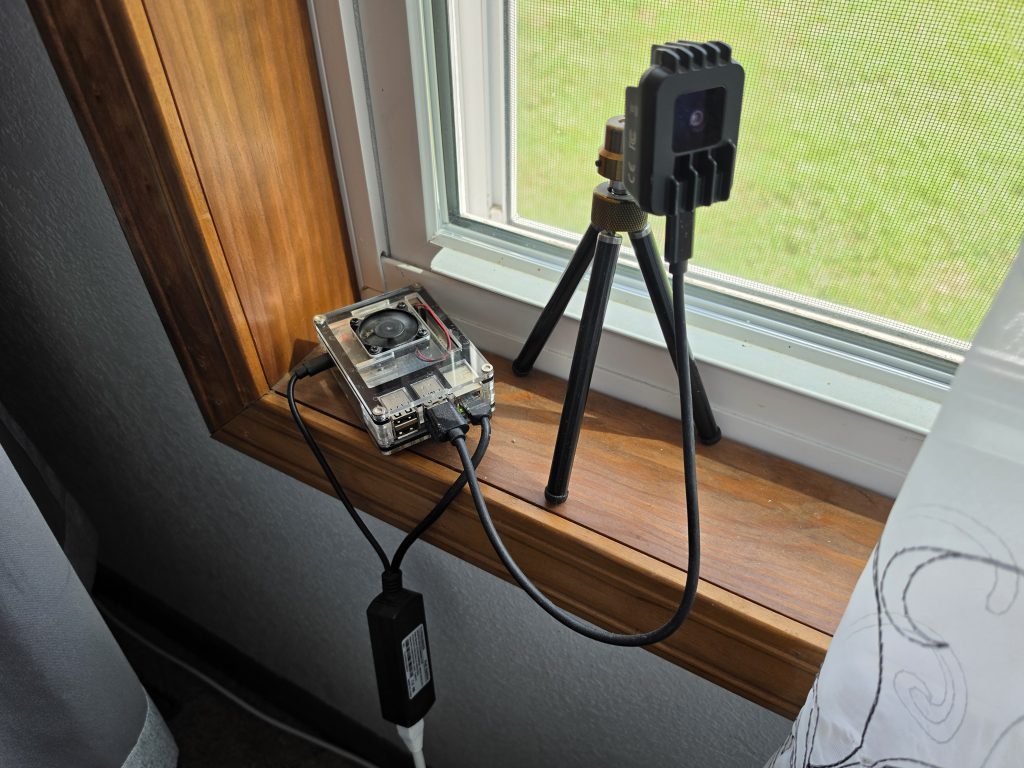
The serendipity was that the Watchtower prototype had just stabilized and was now hanging on the wall as a kiosk. Each new event produces a sample image that’s pushed to the display. Suddenly, we had a constantly changing slide show of vehicles passing by the house.
So I asked Claude to write me a VASCAR task.
VASCAR is an old idea, and a simple one — it’s what police used before radar got cheap. You mark two points a known distance apart, time how long a vehicle takes to travel between them, and divide. No radar, no lidar, no special hardware. Just a clock and some arithmetic, which a camera watching a street happens to be extremely well positioned to provide.
It worked. Not perfectly — I’ll have a great deal to say about not perfectly in the next post, and about a car my system once clocked at 162 miles an hour — but it worked well enough that within a couple of days I was looking at real measurements of my own street.
Here is six seconds of it working.
Two cars passing in opposite directions. The southbound one — which anecdotally, seems to be the faster lane — is doing 42 in a 25. The northbound one is doing 22.
…how fast was that one going?
Before long this led to a regular chorus of us calling out in amazement: “how fast was that one going?”
The joke was the answer
Here’s what I hadn’t seen coming.
I had spent years building a machine learning pipeline for a problem with almost no data in it, while a firehose of near-perfect training data drove past the house every single day.
Thousands of vehicles. The same camera, the same geometry, the same stretch of pavement, over and over.
Think about what the street actually produces. Thousands of vehicles. The same camera, the same geometry, the same stretch of pavement, over and over. Many of the same cars, repeatedly, at roughly the same times — because they’re commuters, and commuters are creatures of habit. School buses and garbage trucks run on schedule. Mail and package delivery are routine occurrences.
That is a far better environment for building recognition than my front door will ever be. Same fundamental problem — is this the same subject I saw before? — but with enough examples to actually learn from, and a built-in way to check the answer.
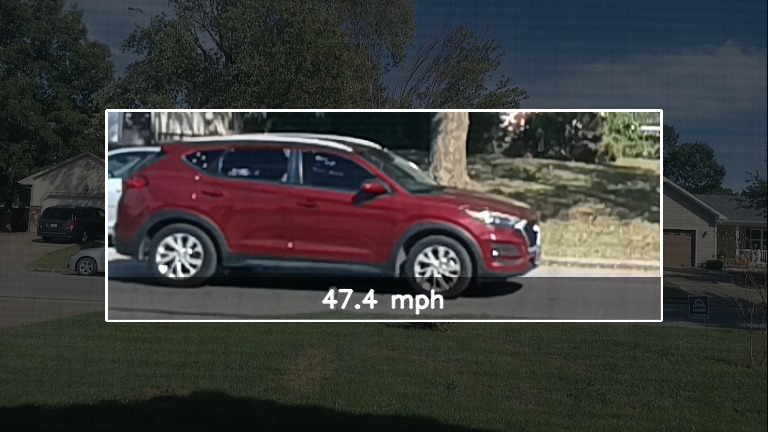
The joke I’d been telling for years about modeling the speeders turned out to be the serious idea. The thing I’d been serious about turned out to be the hard, thin, data-starved one. I had it exactly backwards, and it took pointing a camera at the street to notice.
I don’t intend to abandon faces. But the vehicles are where the method gets built, and the faces get the benefit of it later.
So what’s actually happening out there?
That’s the question I wanted answered from the beginning, back when it was still a punchline.
Is it really as bad as it looks from the porch? Is it the neighbors, or is it the through traffic? Is it worse at certain hours, on certain days? Is southbound genuinely faster than northbound, the way it seems, or is that just where I happen to be standing when I notice?
I have the data now — several thousand measured vehicles on my own street. Could it be a source of advocacy for the neighborhood?
The next post is what it says, and how much of it I ended up believing.